

How to use DuckyHelper in Power BI
A Power BI report shows the numbers, but not the story: why the total fell, or what to say about a chart in a meeting. Ask about the report on your screen and DuckyHelper explains it and circles the cause. You can also hand it the export or a weekly summary of what changed (Early access).
Find why a KPI dropped
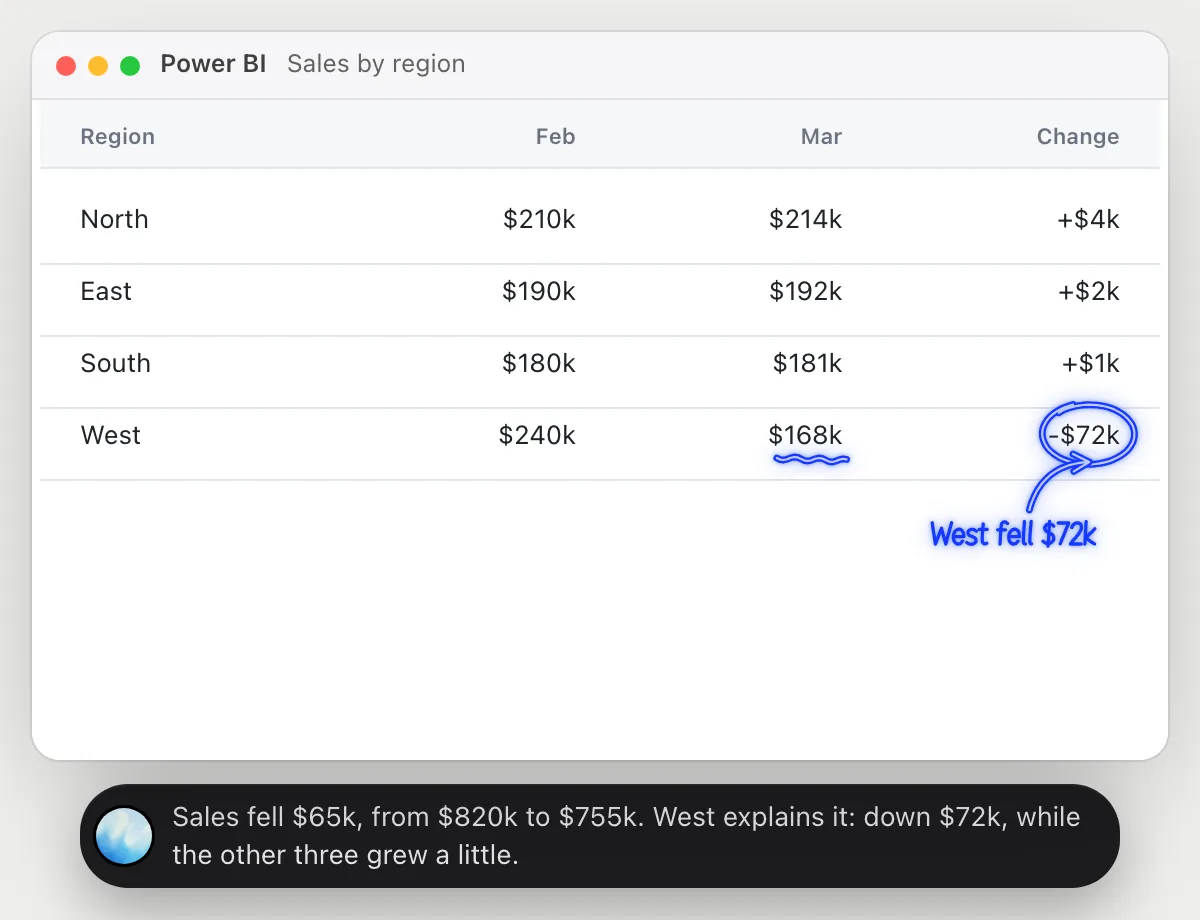
“Why did this KPI drop in March?”
- 01Open the report page with the table that breaks the number down.
- 02Ask out loud. DuckyHelper reads the rows and compares March with February.
- 03It circles the row that fell the most and underlines the figure behind it.
- 04Ask whether the others moved, and it answers from the same table.
You getThe one region behind the drop, found without exporting anything.
 Sales fell $65k, from $820k to $755k. West explains it: down $72k, while the other three grew a little.
Explain a chart for a meeting
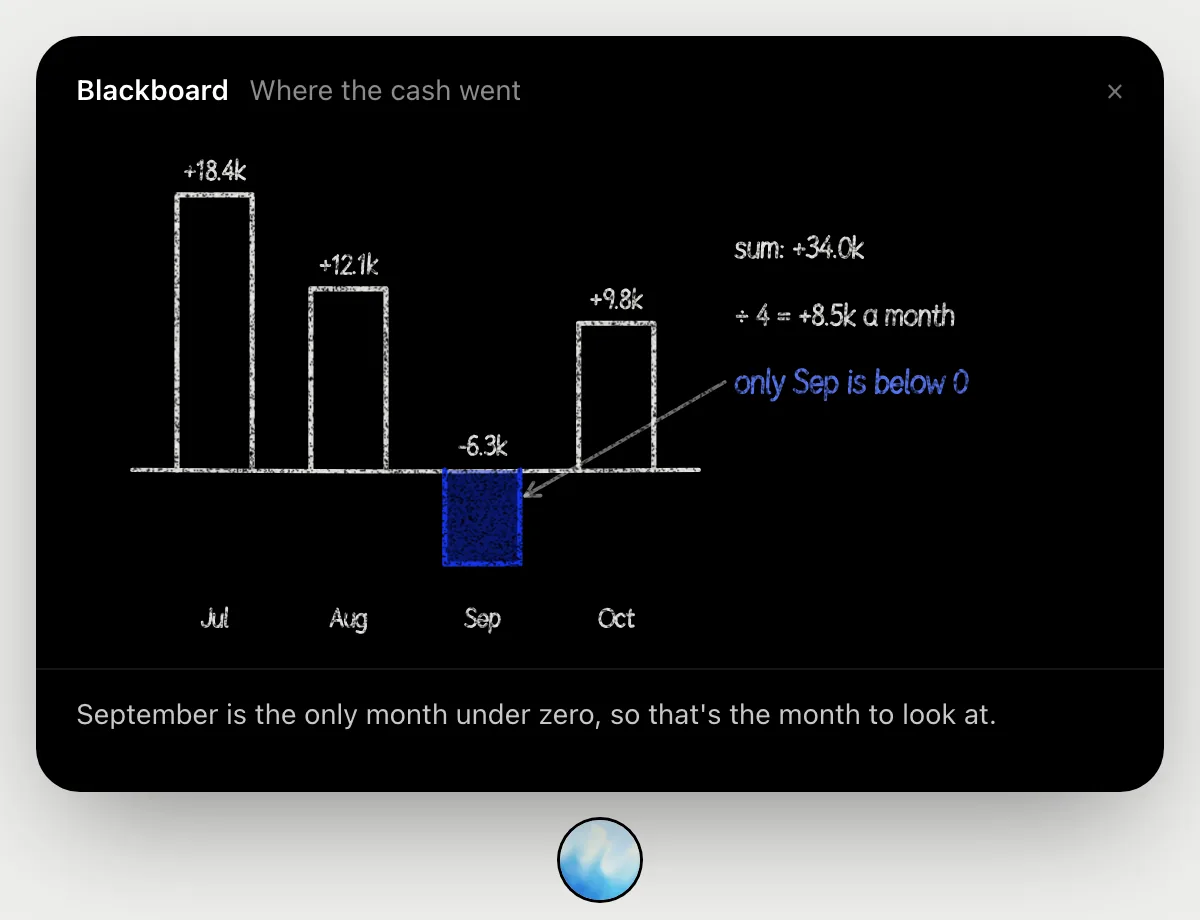
“Explain this chart so I can present it in two sentences”
- 01Open the report page with the chart of net cash by month.
- 02Ask out loud. DuckyHelper reads the bars and opens the blackboard.
- 03It draws the four months, adds them up and works out the monthly average as it talks.
- 04It marks the only month below zero, then gives you the two sentences to say.
You getA chart you can explain in two sentences, with the sums worked out where you can follow them.
Export a table and send it
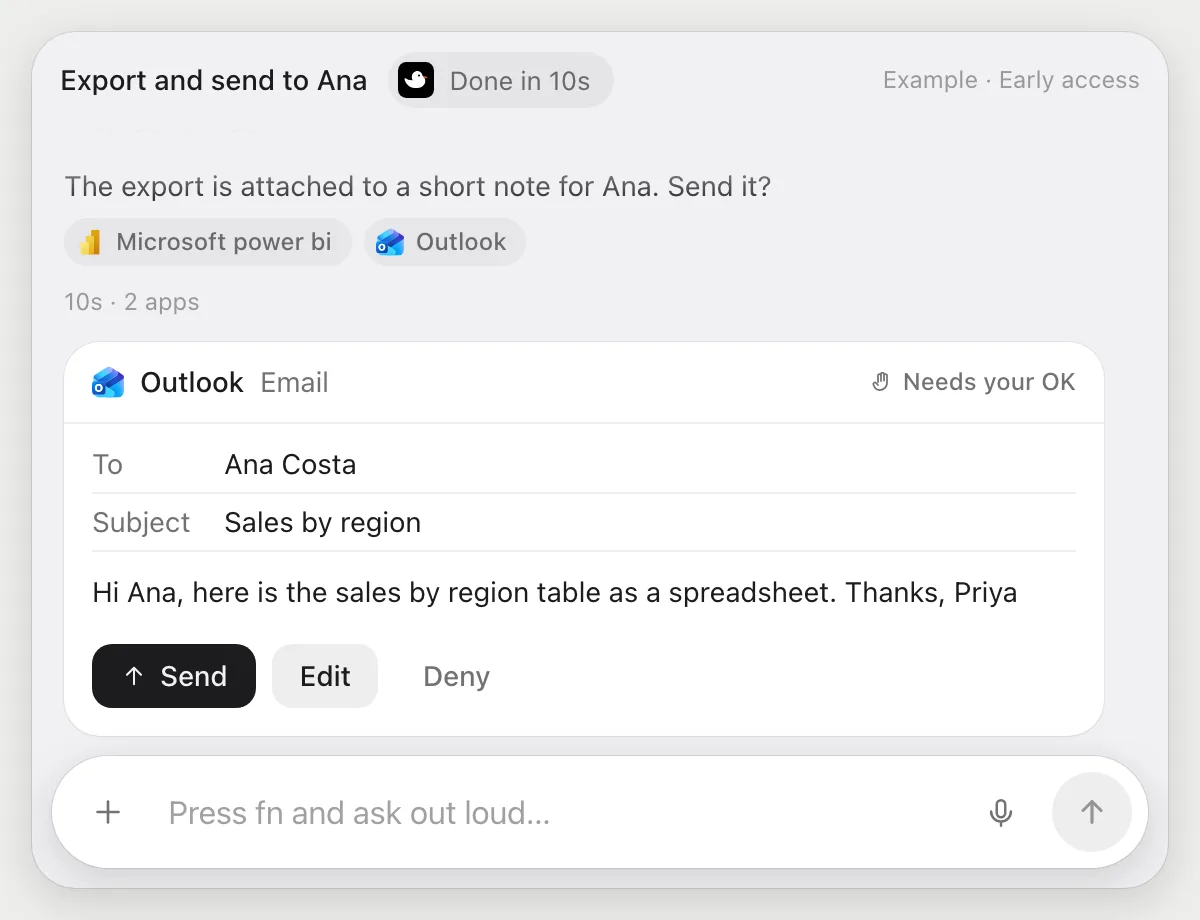
“Export this table to Excel and send it to Ana”
- 01Open the report with the table showing and say who it goes to.
- 02DuckyHelper uses the table's export option with its own cursor to get the data as a spreadsheet.
- 03It opens a new email to Ana and attaches the file.
- 04It stops before sending and shows the recipient and the message. You press Send, Edit or Deny.
Built to ask firstThe file goes to another person, so it shows who gets it and the message with Send, Edit and Deny. Exporting needs no OK.
You getThe table in Ana's inbox as a spreadsheet, sent only after you looked at it.
Post the top changes every Monday
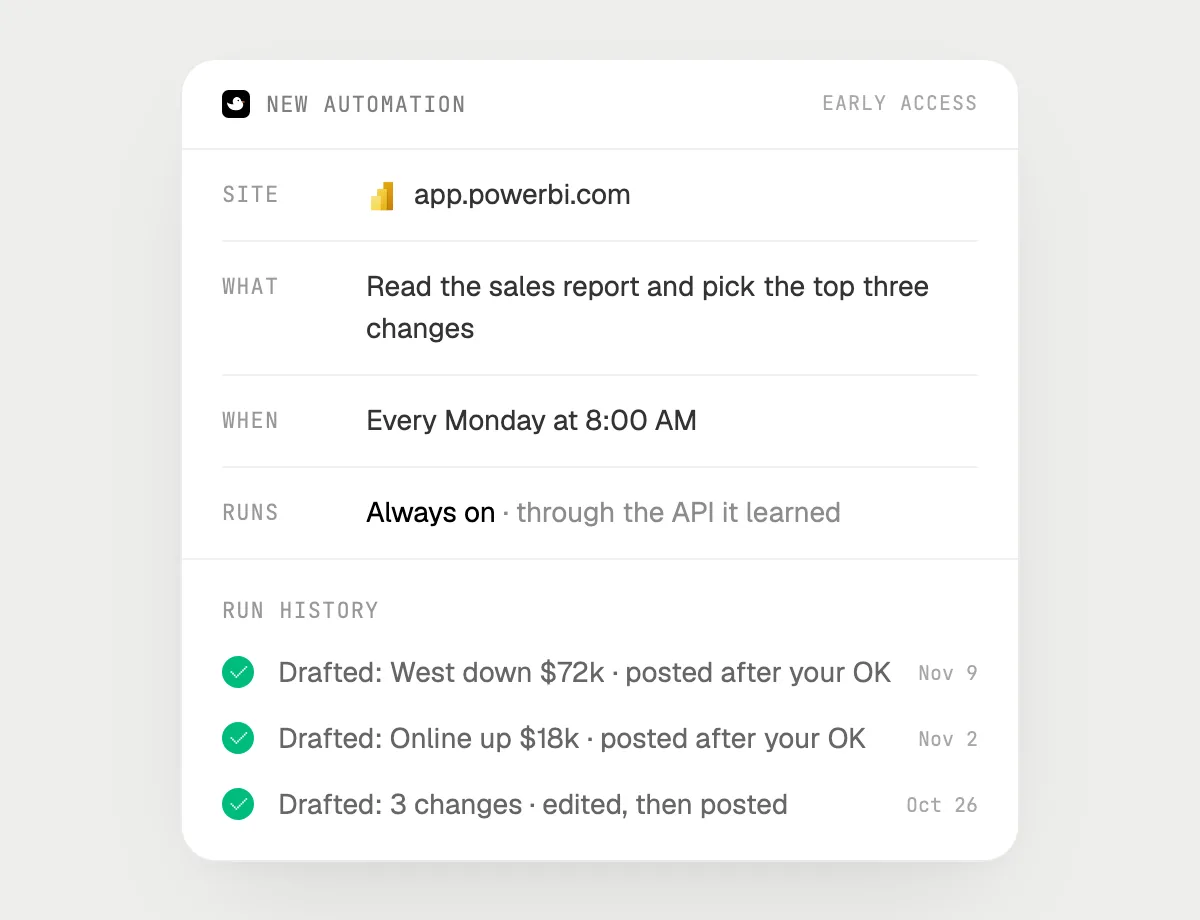
“Every Monday, check the sales report and post the top three changes in #sales, asking me first”
- 01Say it once with the sales report open. It writes this week's note right away.
- 02It learns the report's own actions the first time, so later runs are quick.
- 03Turn it on from the card it offers. It runs every Monday morning.
- 04Each run lands in the history, with the note it drafted and whether you approved the post.
Built to ask firstReading the report and writing the note need no OK. Posting in #sales is a send, so each post waits for your Post, Edit or Deny.
You getA Monday note on what moved, written for you and posted only when you say so.

Getting more out of it in Power BI.
- 01
Show the visual's title and axes on screen. DuckyHelper explains the labels it can read.
- 02
Ask for the two-sentence version when you present. Say who the audience is and it adjusts the wording.
- 03
It explains what the report shows. It does not rewrite your data model or your measures.
- 04
Pulling the numbers into a workbook next? The Excel guide picks up from there.
Questions about Power BI.
Do I need to connect my Power BI account?
No. There is nothing to connect. It reads the report on your screen while the pill is open. Jobs (Early access) use Power BI in your browser, signed in as you, and it's built not to type your passwords or card numbers.
Does it work in Power BI Desktop?
Asking works on whatever is on your screen, so it can explain a report in Power BI Desktop on Windows. The jobs in this guide use the browser.
Can it post or email without asking me?
It's built to ask first: anything that goes to another person shows its recipient and words first, with Send, Edit and Deny. It may not recognize every send or payment, so keep an eye on tasks that involve messages or money.
Can it change my report or data?
It explains what is on the screen. This guide does not cover editing reports or data models.



Do anything
Ask it a question or hand it a job, in any app.



Doing jobs for you is in early access on Mac. Asking works on Mac, Windows and Linux.